
Data Analytics Online Pre-Programme
Data is a big driver of growth and change. And according to the faculty behind this pre-course, it’s fast becoming the most valuable resource in the world.
The Aim
 Degree students are expected to understand certain fundamental concepts, terms and principles before they begin. In the case of data analytics, this foundational knowledge is essential not just for the core course, but also for many of the others they’ll take throughout their MBA programme.
We wanted to design more effective and engaging ways to build and test that foundation. In the case of data analytics, much of this requires student practice and iteration, so we knew we wanted to expand and enhance those features. We also wanted to enhance exercises with more relevant, real-world examples, knowing that learning is more profound when students can relate it to something they already know.
The Approach
Updates & Enhancements
This year, we’ve updated the assessments, interactions, and videos, as well as the overall content and design of the online course.
Since the previous version focused primarily on delivery, with minimal space for application and practice, we decided to rework the balance of the exercises. The new framework builds in more space for student practice, knowledge checks and sharing thoughts.
Structure & Format
To help students build strong knowledge organisations, we designed the course structure to be as simple and clear as possible. To show the “big picture” upfront, we explicitly share the knowledge organisation of the course and sessions on the home page. By clicking on each module, students see the further breakdown of topics.
Clear and meaningful headings are written for maximum clarity on the structure. Students know exactly where to go and in what sequence and navigation buttons lead to “help” sections in case they lose their way. Goals and priorities are clearly spelled out for each task to help students manage their cognitive load. Knowing that the structure of information affects the comprehension of the content, we’ve designed all the components with this in mind.
Content Development
 Faculty collaborated to identify the topics as well as the individual knowledge and skills that students needed to be covered. The Learning Innovation team worked to design improved learning experiences to help students build, practice and self-check these individual component skills. Together we brainstormed to structure the course according to proven best practices.
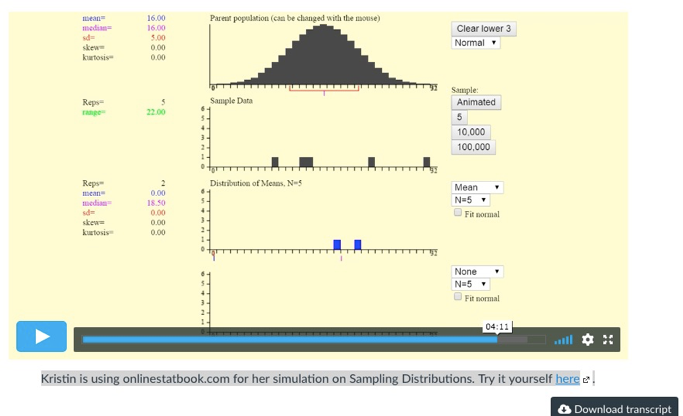
We added exercises and case studies to activate students’ knowledge by adding relevant connections. Real-world examples were integrated to make problem-solving more compelling and effective. Stories and interactive videos were added to bring data and graphs to life.
As a result, students gain a broad overview of data analytics and the range of tools, methods and models used to achieve specific business goals. The more they learn about data-driven decision-making, the more they discover relevant connects to real-world applications all around them.
The Outcome
 The final product meets both learning and design objectives. The online course effectively introduces a selection of basic data analytics concepts and tools — ones that students will encounter in their core course on campus. Learning is reinforced through creative exercises and tested at regular checkpoints. Students gain confidence through extended practice. By mastering the fundamentals, they’ll be able to build on that knowledge during coursework and move ahead, rather than having to play catch-up.
The skills acquired from this online course will be used widely across their Degree program.
The curriculum was designed to ensure basic knowledge of the following topics:
- fundamental data analytics tools and concepts (as chosen by faculty)
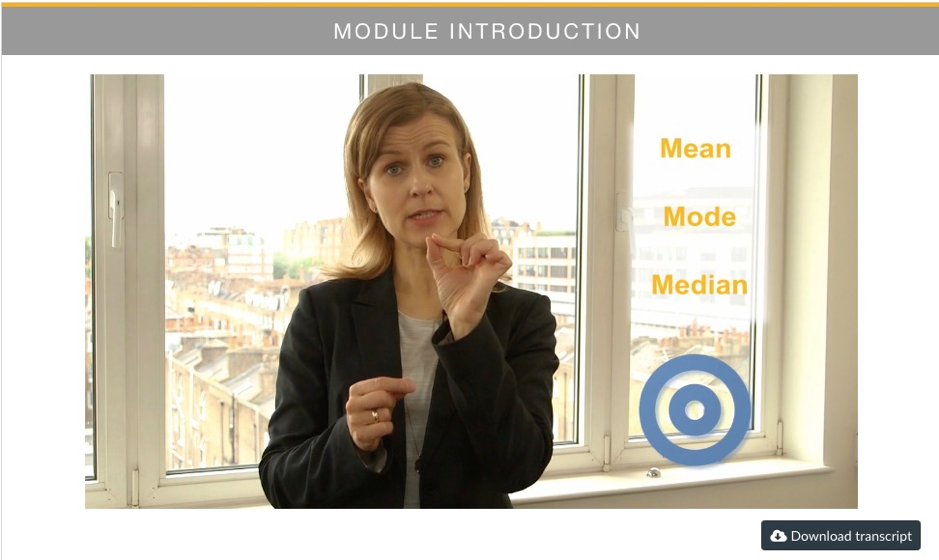
- data communication (using histograms to measure central tendency and variability)
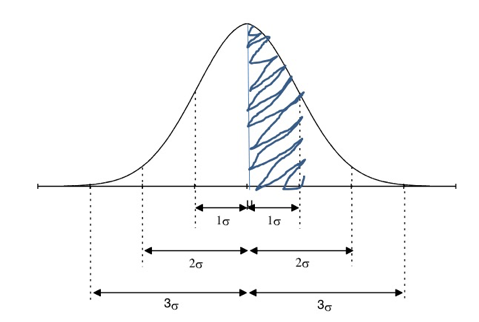
- normal distribution and its usage
- opinion polls, marketing surveys and the concepts behind them
Quizzes are set to allow multiple attempts to give opportunities for practice. We opted for no time limit to allow students to review their answers and find the best solution. Quiz responses allow students to see what they answered, any automatic feedback generated by the quiz for correct or incorrect answers, and which questions they got wrong. In the final assessment, the quiz is set with only two attempts and students can see only their correct answers.
Hosted on Canvas, the online course consists of three main modules plus a final summary and assessment. Each module is divided into numbered sections and ends with a quiz. Since the modules build on each other, we recommend students work through them in the set order.
The Impact

- This pre-requisite knowledge gives students a sound understanding of basic concepts as well as practical skills to build on.
- Exercises improve decision-making skills. which will be used widely across their MBA degree program in the terms ahead.
- Students begin the core course with a greater appreciation for the subject, having already “connected the dots” through real-world case studies and online practice.
- Faculty have greater assurance that students are starting their core courses on an equal footing, with minimal need for review or catch-up.
Photo by Chris Liverani on Unsplash