What is it?
Infogram is a data visualization tool that allows people to create and share engaging digital charts, infographics, reports, and maps.
How is it used?
It is very easy to use as it has a drag and drop interface in which you could import and download data and it does not require any coding skills. It could be used to create dynamic and interactive content through:
infographics |

reports |

slides |

social media posts |

maps |
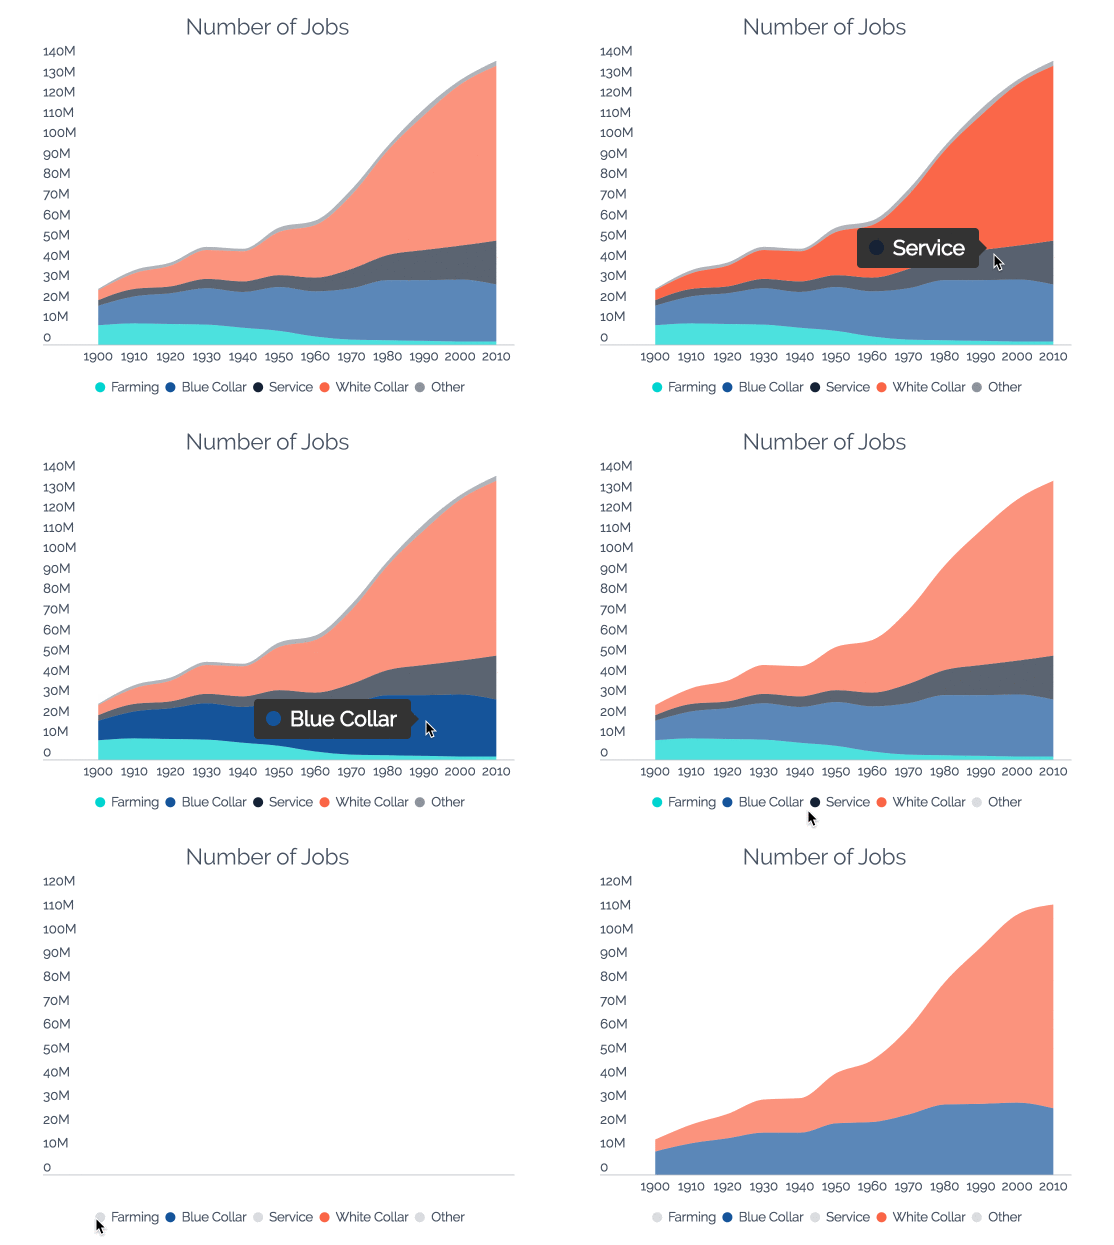
charts |
Also, it allows for real-time collaboration and has an extensive template library and branding support.
Analytics on:
- Viewer demographics
- Average on-screen rate
- How many people shared the created content
- The number of users that hovered over tooltips, tabs, and legends
Integration:
It could be shared as an iframe or a URL and can be integrated with a range of systems such as:

Google drive |

Flickr |

Youtube |

Vimeo |

Slideshare |

Giphy |
Why use it?
Using Infogram could help make your data more engaging, interactive, and appealing to your audience. It is easy to share and dynamic hence could increase efficiency and decrease workload.
Who is using it at London Business School?
It is used by the Digital Learning team.
How can I access it?
Please contact Digital Learning.
